Nyquisis: pdfDropDuplicate Remastered
date
Feb 9, 2022
slug
nyquisis-pdfdropduplicate-remastered
status
Published
summary
Nyquisis is a tool to drop duplicate pages in a PDF file.
type
Post
tags
Python
DataScience
Estimated Read time: 6 minutes
TL;DR: Nyquisis is a tool to drop duplicate pages in a PDF file. It uses image hashing algorithm to differentiate between similar and different neighboring pages.
Notice: This article may subject to a few updates in the future to illustrate a few concepts.
This started when I was a sophomore student. The lecture slides provided by a professor had plenty of duplicate pages for display - and it just ruins your experience to review the slides. I wrote
pdfDropDuplicate to automatically delete the duplicate pages. Then I forgot about this small script.Until last week. I was annoyed, again, by the lecture slides of Optimization Methods in SIGML, with that much duplications again. I found out the old script and it still worked. But the code was really shitty. That’s why I made this remastered version of it, now available on PyPI.
The package name
Nyquisis comes after Harry Nyquist. If you know the famous Nyquist–Shannon sampling theorem, it’s named after Claude Shannon and him. Broadly speaking, Nyquisis is indeed doing a down-sampling job.To use the tool, simply run In your shell
$ pip3 install nyquisis
And then
$ nyquisis ./pdf-to-drop.pdf
Check out the GitHub Repository for more details:
How it works
Nyquisis exploits a concept called image hash.
Hashing is basically mapping an immutable object to a fixed length of string. If we have two different files, even if they only differ by one character, their hashes are expected to be very different. Otherwise this is a serious hash collision.
But for image hashes, we expect something a little different. If we have two images, the more similar they are, the closer their image hashes we expect (this is the purpose of image hashes when they were proposed). Read this question on StackOverflow to learn more:
In Nyquisis, pHash (perceptual hash) among the existing four image hash functions is chosen to be the hash function. The pHash starts by performing a Type-II Discrete Cosine Transform (DCT) on the image into the frequency domain:
The DCT transform is similar to a Discrete Fourier Transform (DFT), but it uses only the cosine functions instead of both sine and cosine functions in DFT.
scipy.fftpack already has a very efficient implementation and it defaults to Tyle-II DCT.After the DCT transform, the 32x32 low-frequency components from the upper-left corner of the transformed image will be taken, these are the components that really contributes to the overall structure of the image. The hash is simply whether each element in this 32x32 matrix is greater than the median.
The DCT transform grants pHash the ability to ignore details in the image, and only focusing on the broader similarity. To illustrate the effect of image hashing, here’s three pages taken from one of the slides when I took Introduction to Signals and Systems two years ago.
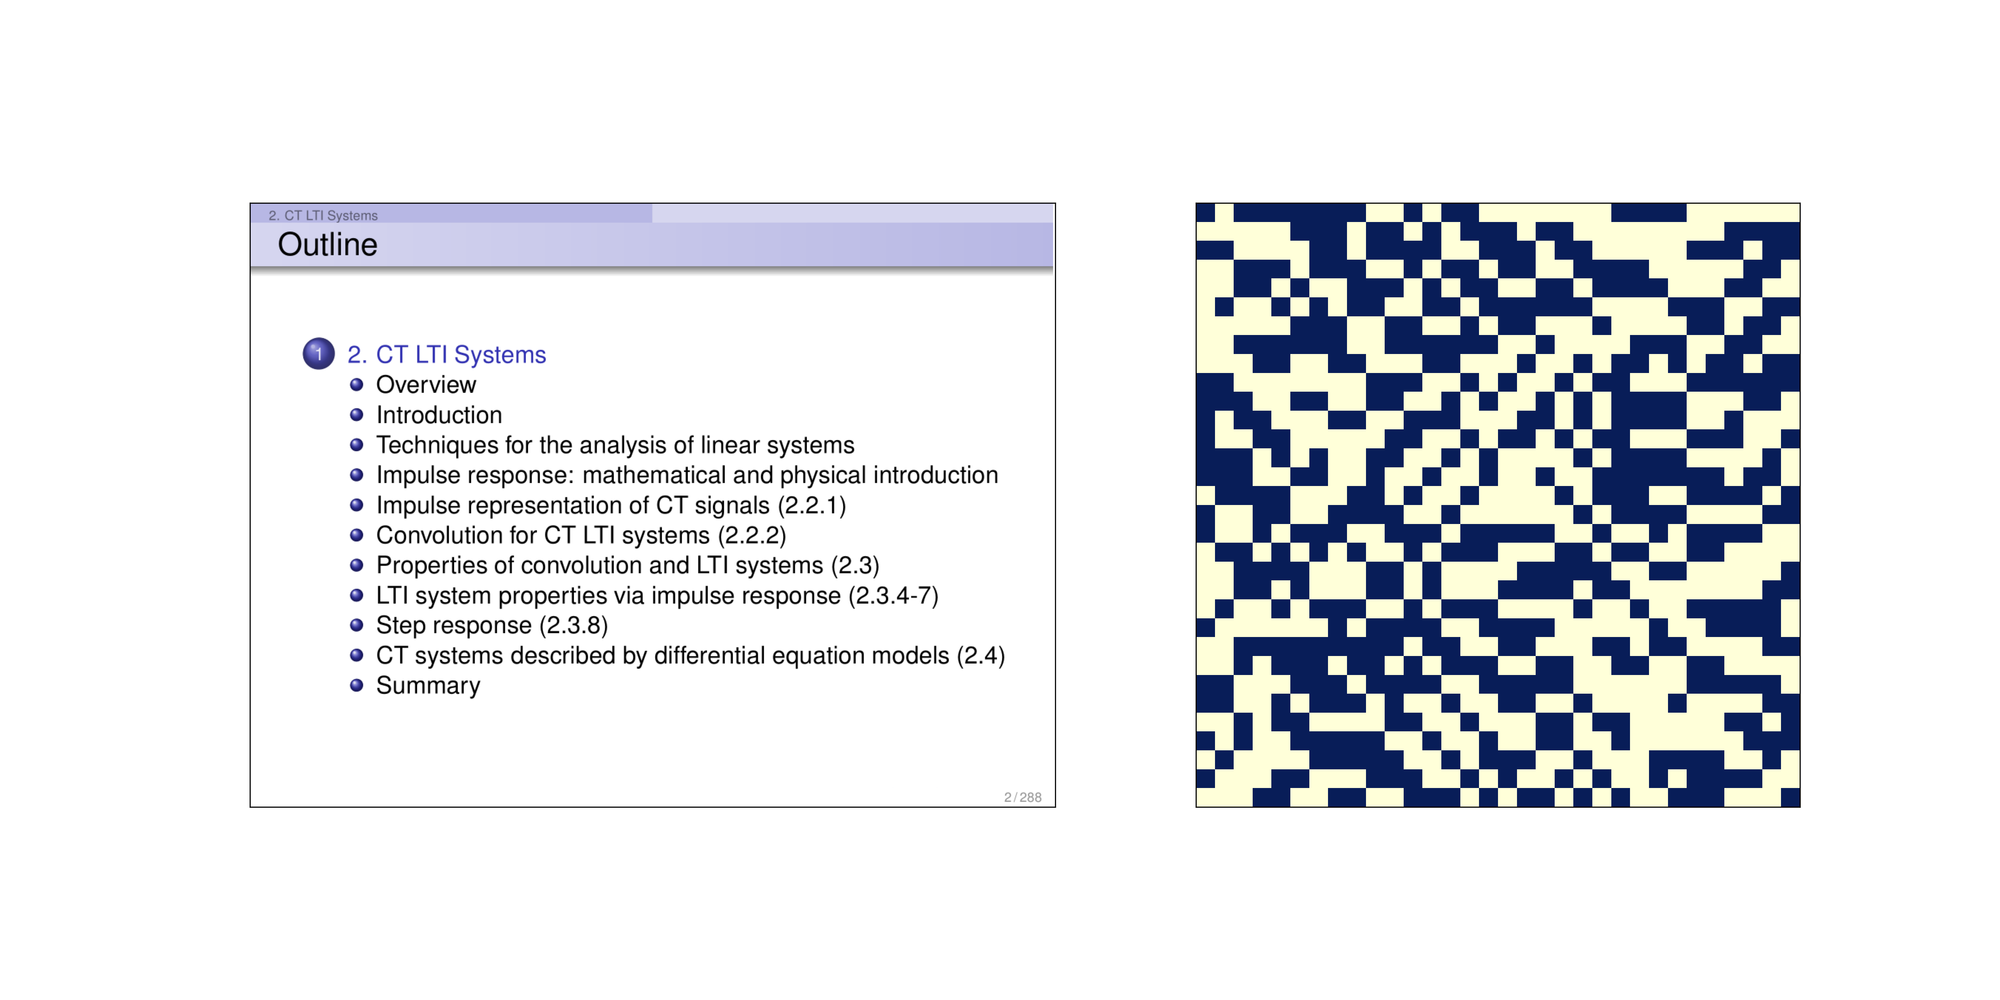
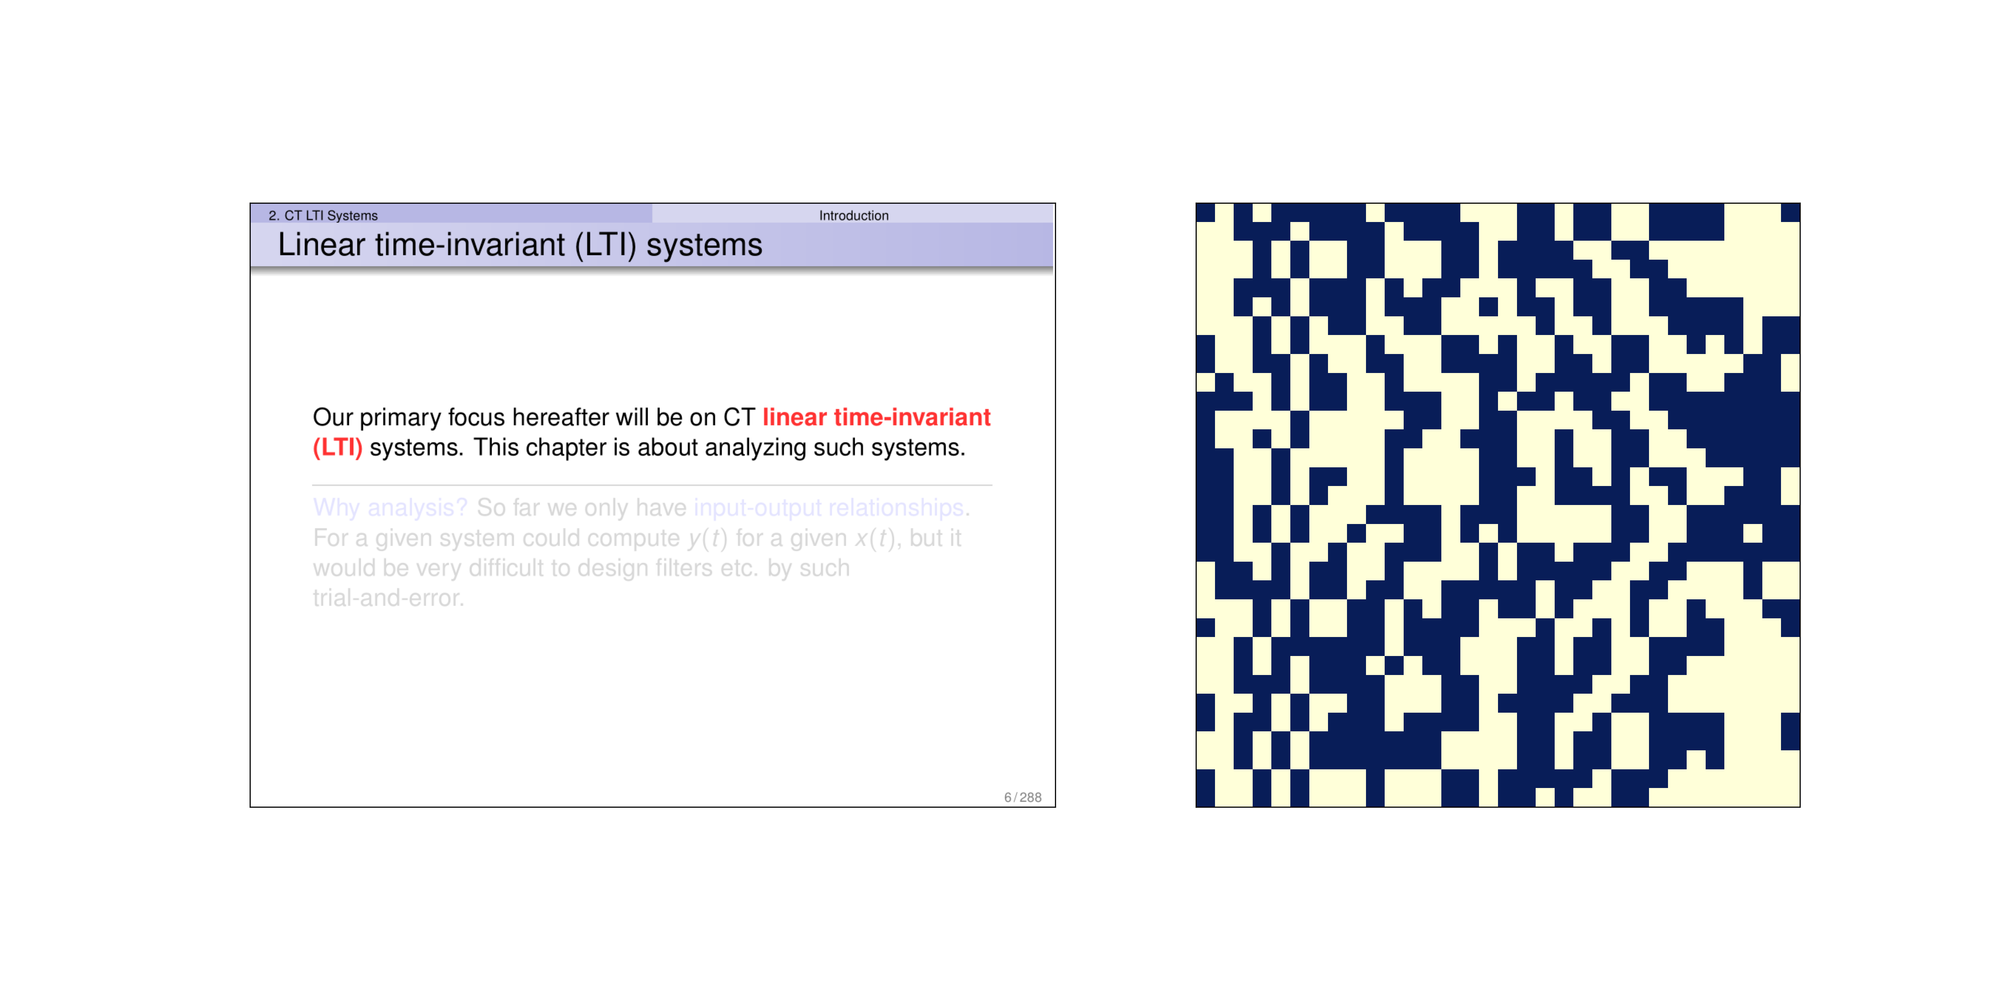
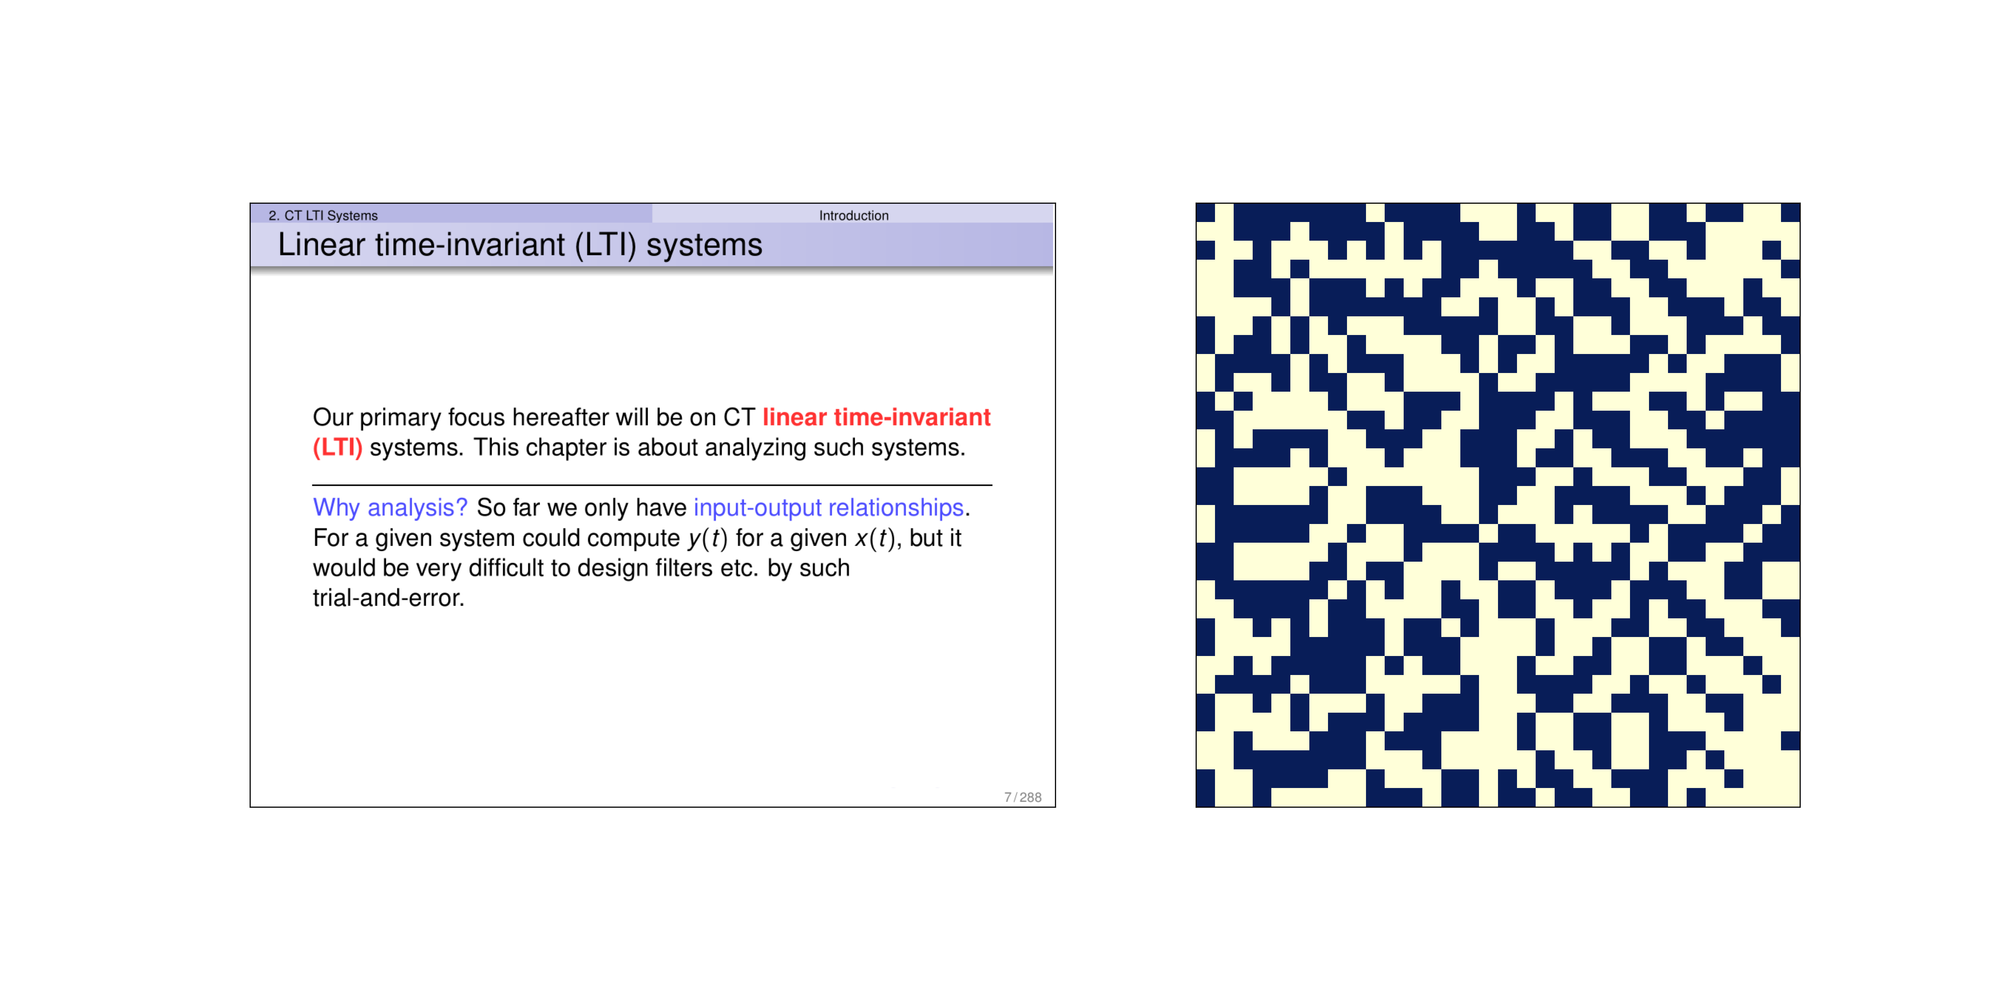
The latter two images are considered similar images. You can notice that there are simiar patterns in their image hashes in many locations. Taking bitwise-equal of the images hashes, this is the result of the first two images:
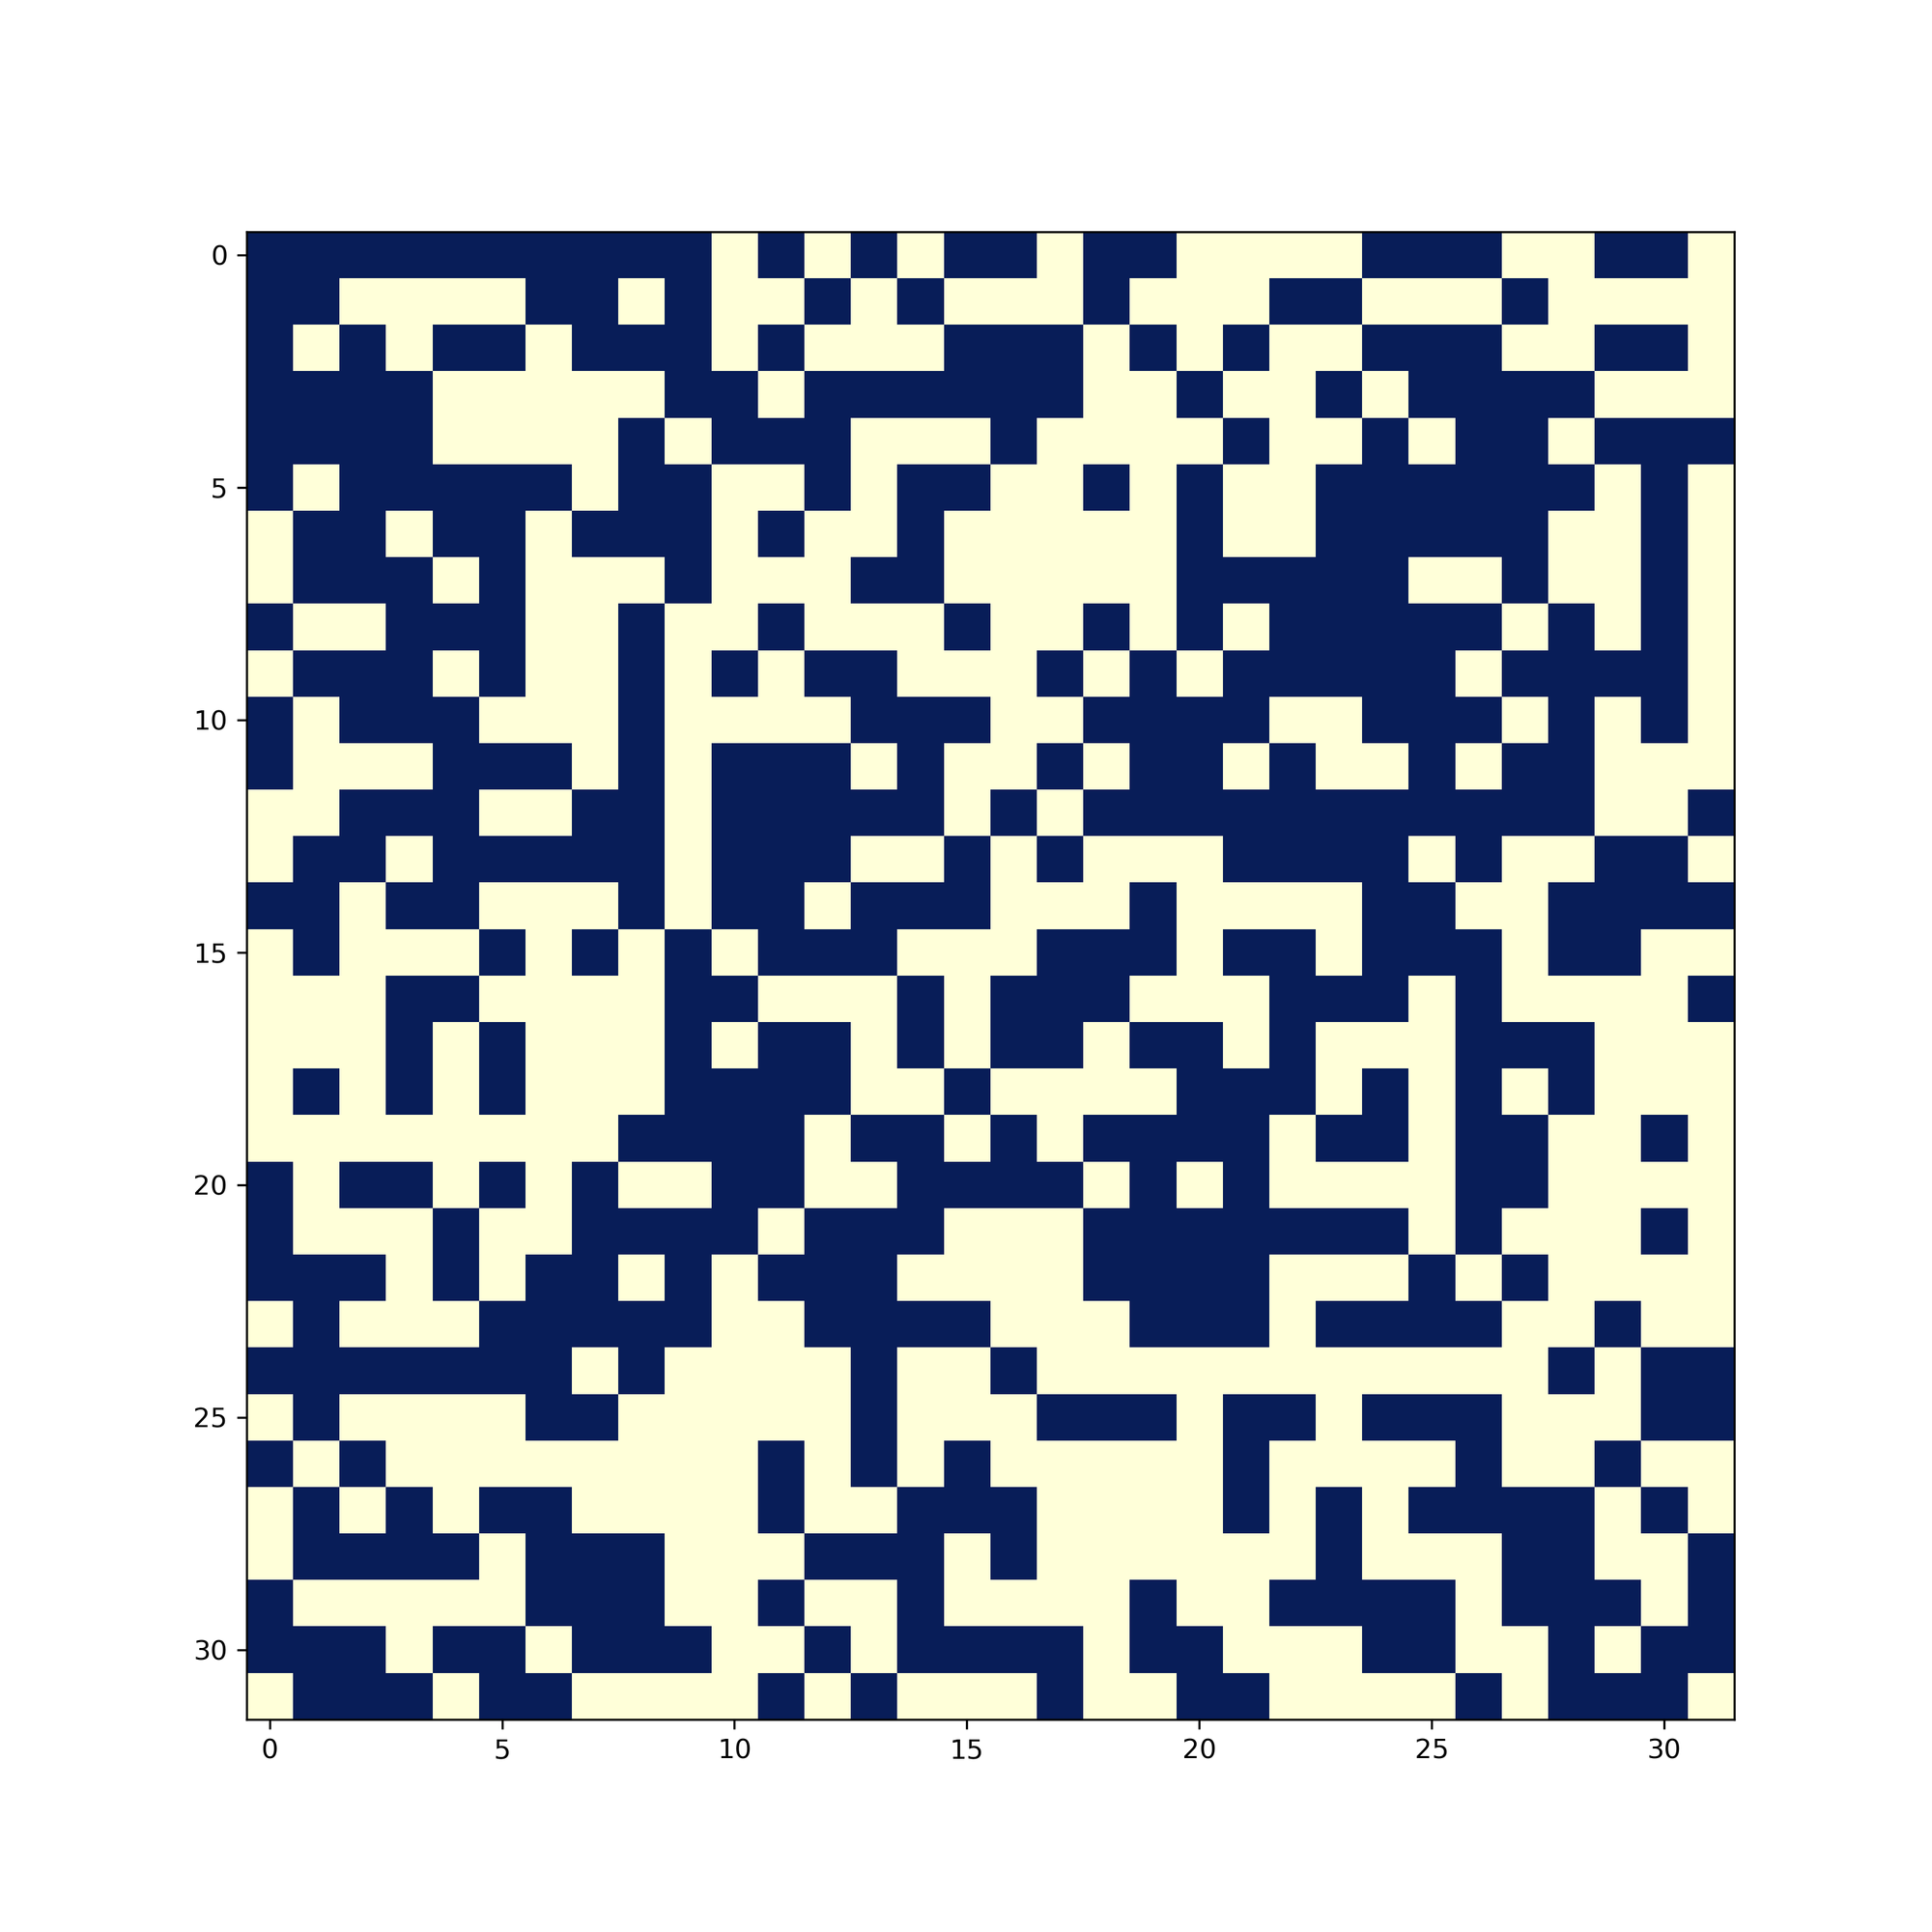
And this is the result of the latter two images:
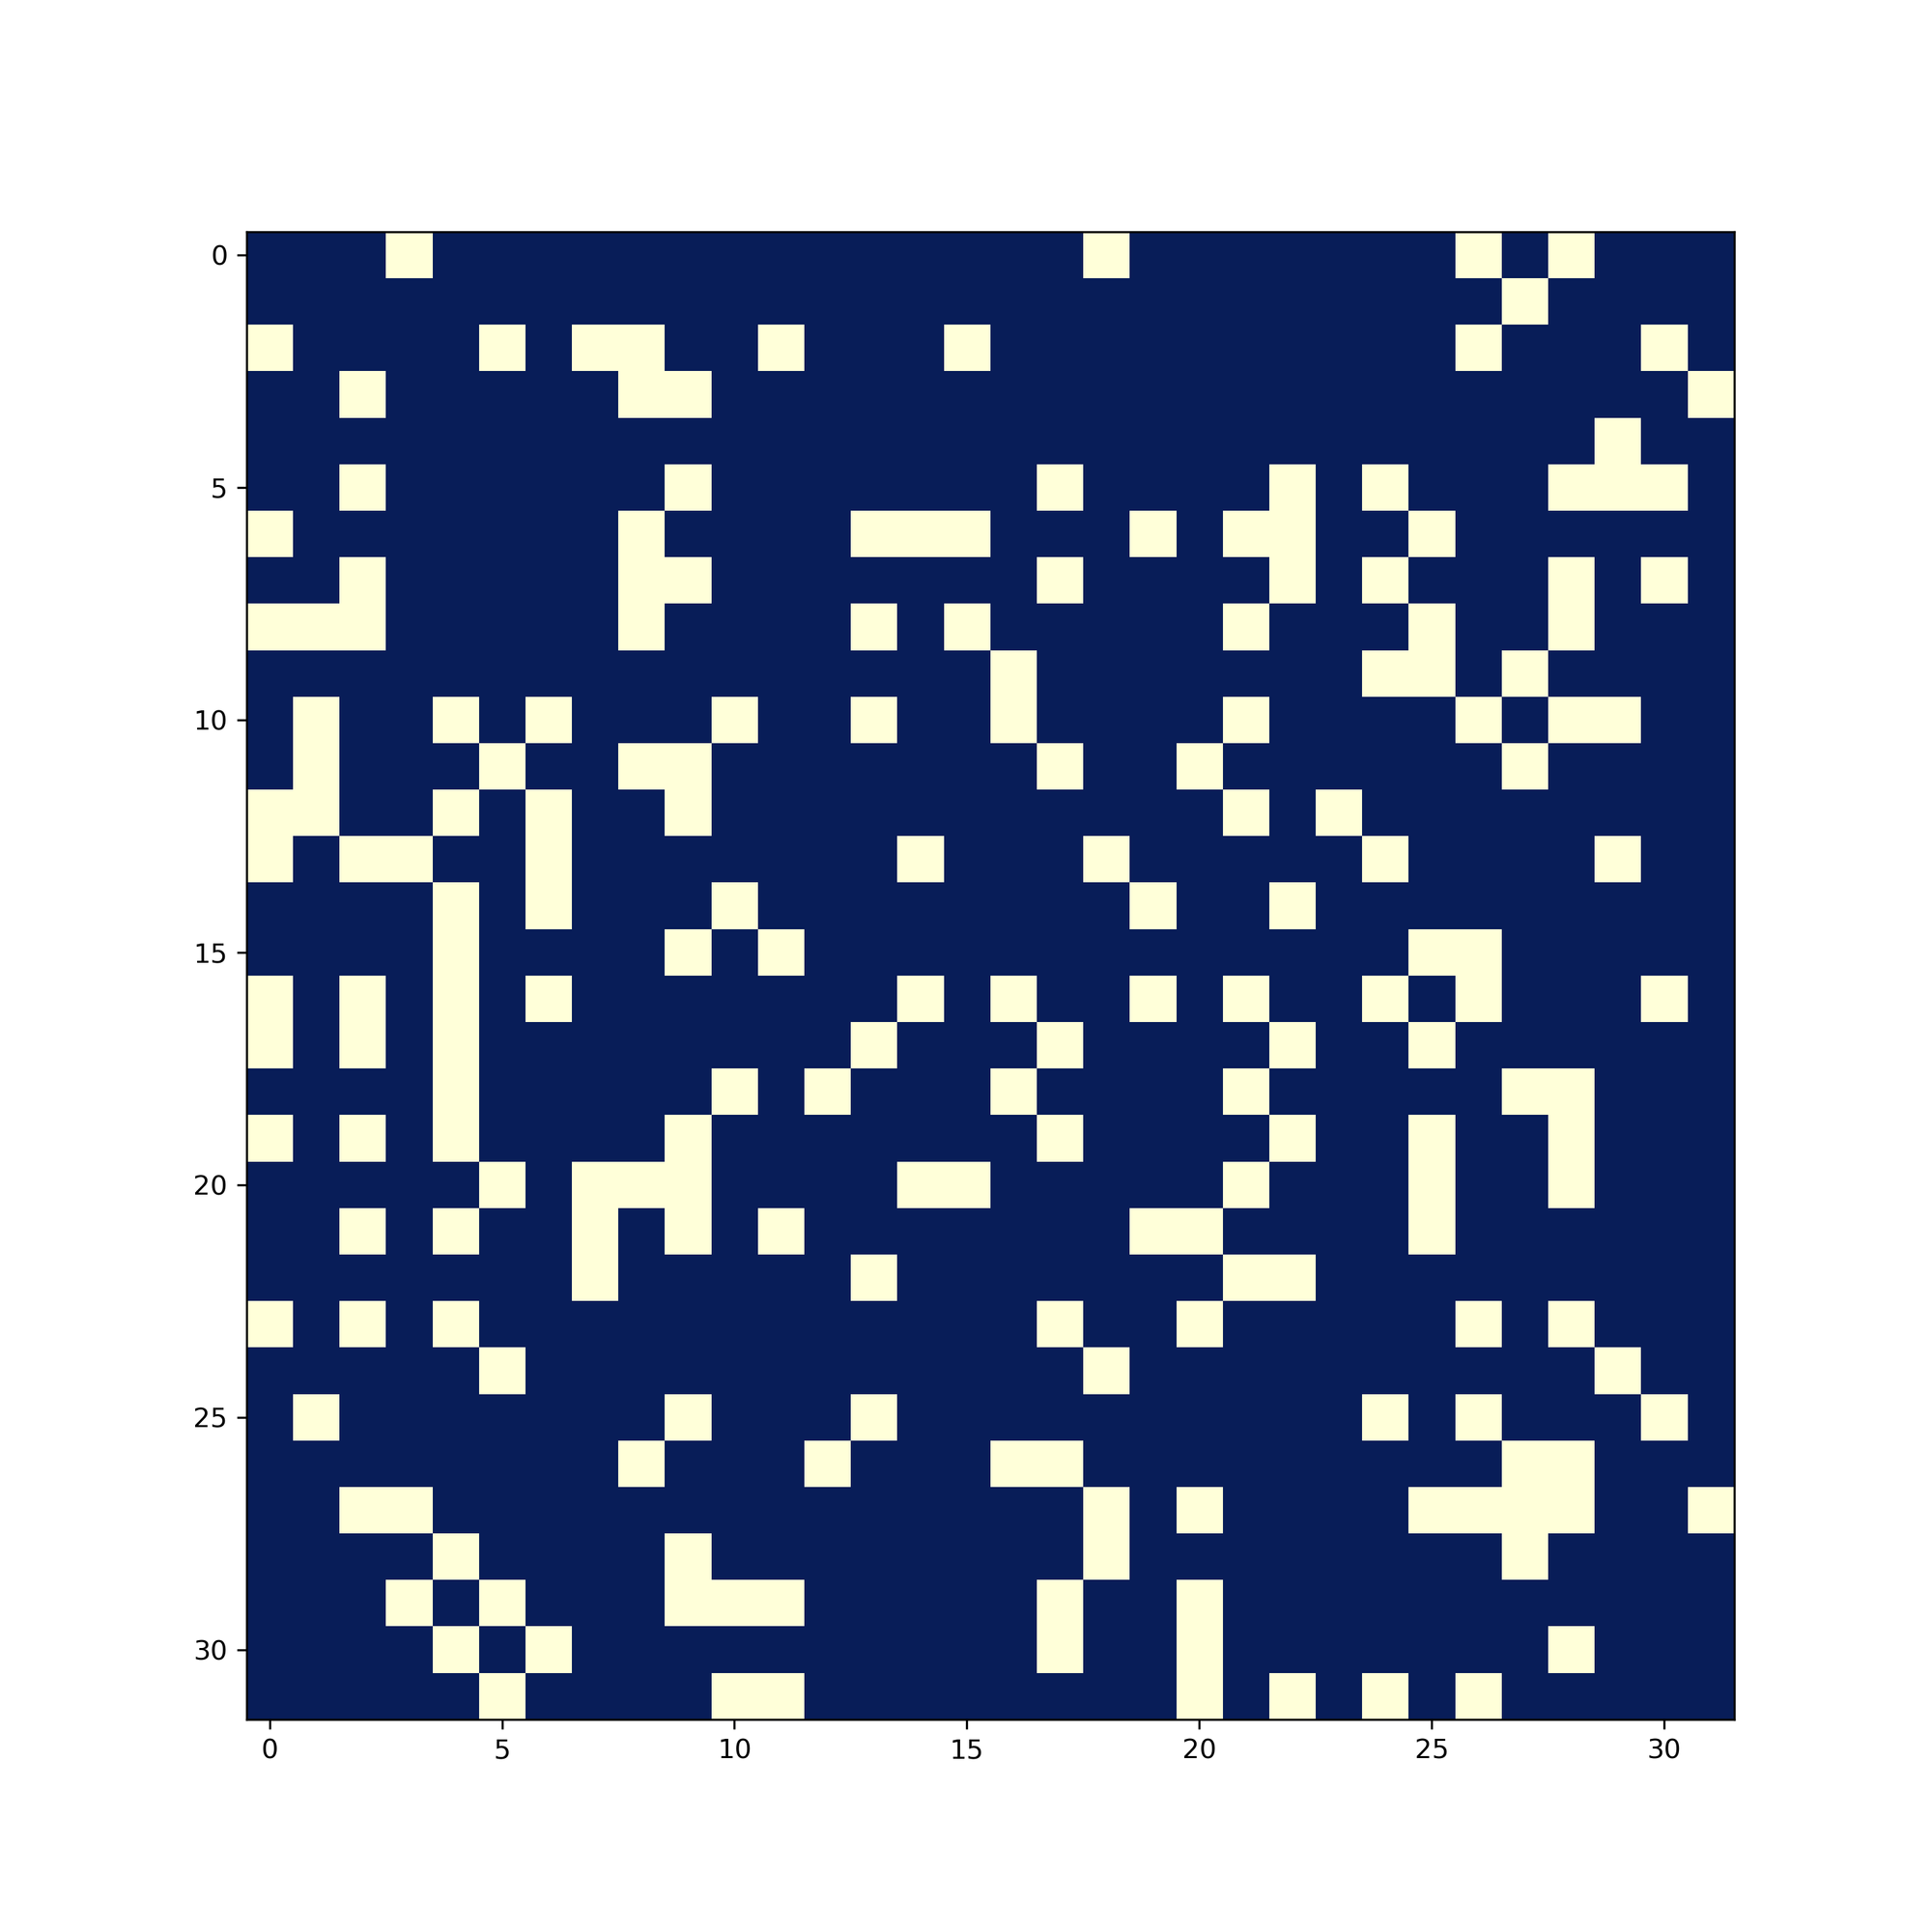
The difference is significant - and quantizable. Hamming distance is used between the image hashes to quantize the difference. The Hamming distance between is defined as
It is essentially performing a bitwise XOR operation between the two vectors. Flatten the image hash to a 1-dimensional vector, we are thus able to quantize their difference.
Implementing a robust K-Means clustering
Now, we have a list of hamming differences of each page’s pHash compared to its neibor’s pHash. We also know that they form two groups: a group of larger difference, indicating the two pages are different; and a group of small difference, indicating the two pages are similar. The next step is to seperate the two groups, and simply delete pages from the latter group.
In older versions, I assigned a fixed threshold to detect whether a page differs from the last too much. This threshold possibly will not work for all different slides, so there must be a better way to decide this threshold. The answer is unsupervised learning.
A K-Means clustering algorithm should suffice here. Assume the
diff array is always clearly distinguishable into two clusters, then we only need to find the center of these two clusters, and take their mean as the threshold. An additional check on whether this threshold does separate the two classes clearly would be even better. Since I’m having one-dimensional data, the implementation is simple. So I wrote it myself instead of importing sklearn:def cluster(diff: list, maxiter: int=200, seed: int=42) -> tuple([int, list]): ''' Run an unsupervised cluster algorithm on the list diff. Assumes the list can be divided by a clear threshold, return that threshold using the mean of the two clusters' centers. Arguments: - diff (list): The list of hash differences. - maxiter (int): Max number of K-means iteration. - seed (int): Seed to initialize numpy's RNG. Returns: int - The calculated threshold list - The centroids ''' diff = np.array(diff) distances = np.zeros((diff.shape[0], 2)) # initialize center of clusters np.random.seed(seed) np.random.shuffle(diff) centroids = diff[0:2] for i in range(maxiter): centroids_temp = centroids.copy() distances[:, 0] = np.abs(diff - centroids[0]) distances[:, 1] = np.abs(diff - centroids[1]) classes = np.argmin(distances, axis=1) centroids[0] = epsilon * np.mean(diff[classes == 0]) + (1 - epsilon) * centroids[0] centroids[1] = epsilon * np.mean(diff[classes == 1]) + (1 - epsilon) * centroids[1] return (np.mean(centroids), centroids.tolist())
Let’s see what it can do with my slides. The input
diff is[16711680, 6160384, 16252928, 5308416, 6029312, 7077888, 15466496, 6488064, 15138816, 16318464, 4849664, 15138816, 5505024, 3014656, 11796480, 14680064, 6225920, 13893632, 5046272, 12648448, 3801088, 12582912, 11141120, 0, 16646144, 11141120, 4653056, 6291456, 4063232, 3604480, 10944512, 6225920, 11534336, 4521984, 15794176, 14614528, 6619136, 13041664, 15990784, 7340032, 15138816, 8126464, 16056320, 17367040, 13565952, 16580608, 7012352, 16187392, 4390912, 3735552, 10682368, 15138816, 11796480, 9437184, 15269888, 17694720, 8323072, 8454144, 8454144, 8323072, 11403264, 10878976, 10551296, 6488064, 15335424, 11665408, 9961472, 16318464, 15532032, 15007744, 16646144, 14614528, 16908288, 11272192, 15532032, 13500416, 14090240, 15859712, 12713984, 12845056, 10944512, 8257536, 14876672, 15859712]
And the above code generates:
iteration  0, centroids: [14496243  7878036]
iteration  1, centroids: [11053975 11019243]
iteration  2, centroids: [11038212 11019243]
iteration  3, centroids: [11038022 11019243]
iteration  4, centroids: [11038020 11019243]
iteration  5, centroids: [11038020 11019243]
iteration  6, centroids: [11038020 11019243]
iteration  7, centroids: [11038020 11019243]
iteration  8, centroids: [11038020 11019243]
iteration  9, centroids: [11038020 11019243]
iteration 10, centroids: [11038020 11019243]
iteration 11, centroids: [11038020 11019243]
iteration 12, centroids: [11038020 11019243]
iteration 13, centroids: [11038020 11019243]
iteration 14, centroids: [11038020 11019243]
iteration 15, centroids: [11038020 11019243]
iteration 16, centroids: [11038020 11019243]
iteration 17, centroids: [11038020 11019243]
iteration 18, centroids: [11038020 11019243]
iteration 19, centroids: [11038020 11019243]
……What happens? This is very common with K-Means, especially when the sample size is small. The ideal cluster centers are around
6000000 and 14000000, but it is converging to wrong locations. Sometimes the convergence is even unstable, it will oscillate between two wrong locations.It’s easy to fix this. In each iteration instead of using
centroids[i] = np.mean(diff[classes == i])
use a soft-update like
centroids[i] = epsilon * np.mean(diff[classes == i]) + (1 - epsilon) * centroids[i]
Now the code would converge to a correct location. The convergence took a little bit longer (60+ iterations) since the soft-update, so I will spare the output here.
Conclusion
To drop duplicate pages from a PDF file, Nyquisis calculates pHash of each page, takes Hamming distance of neiboring pages, and uses K-Means clustering to differentiate from two groups of Hamming distances.
According to my tests, Nyquisis is robust enough. It worked for slides of different styles from a few different lecturers. But as I can’t gurantee it will work for all inputs, if you find any bugs, please don’t hesitate to raise an issue on GitHub.
I may add a few new features to Nyquisis in the future, and some more code to ensure robustness. In the meanwhile, I conclude it is safe to put down this project for now. Thanks for reading.
